The challenge
The client needed KPI reporting over data held in SharePoint lists, in a setting where Power BI licensing, data gateways or governance made Power BI the wrong answer.
SharePoint returns at most 5,000 rows per request and refuses some filters on large lists. Neither limit announces itself, so a simple dashboard can quietly report a smaller number than the truth.
What we built
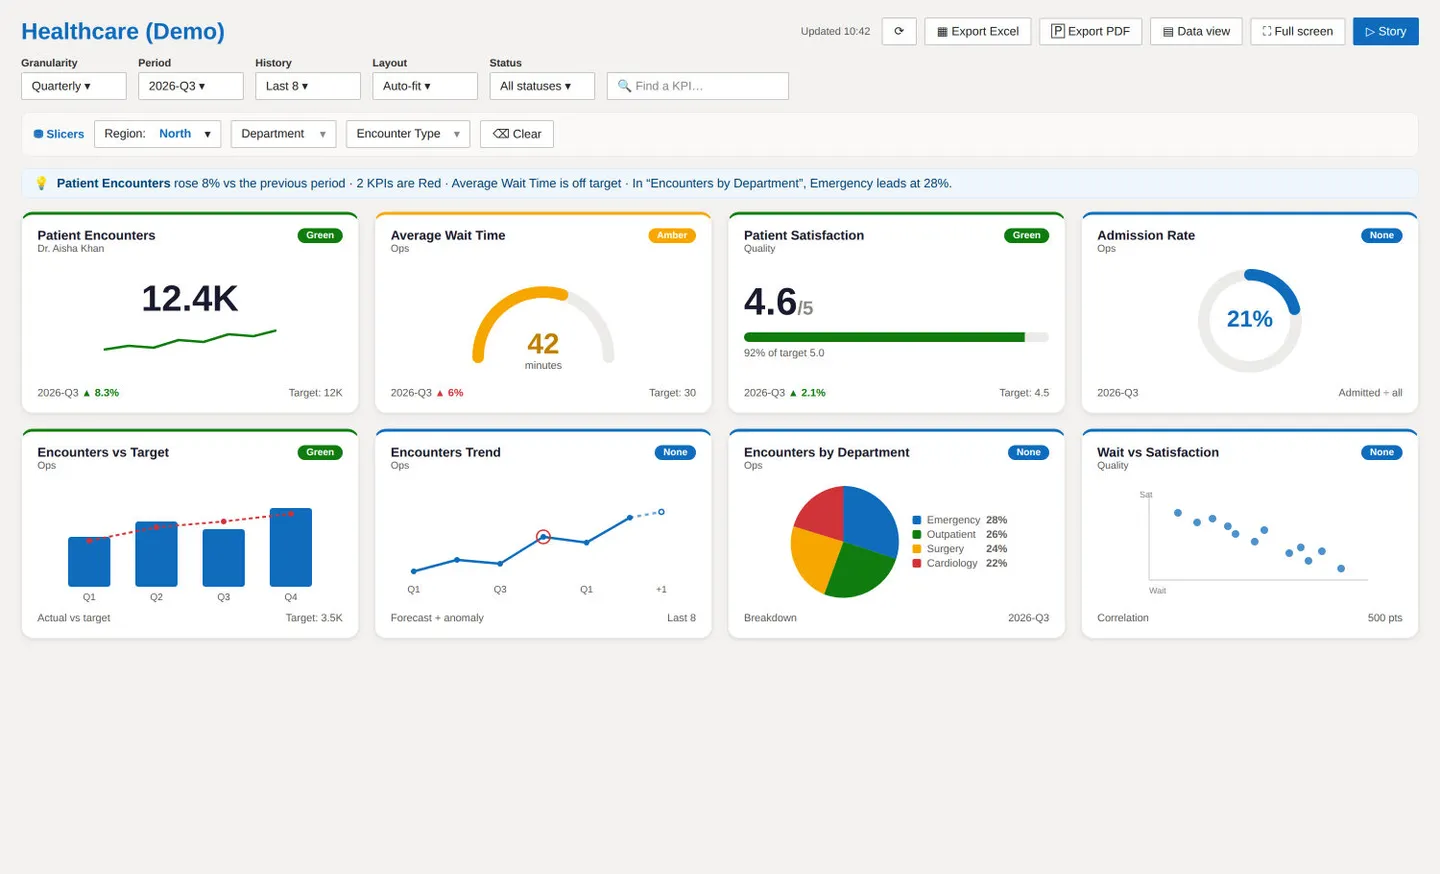
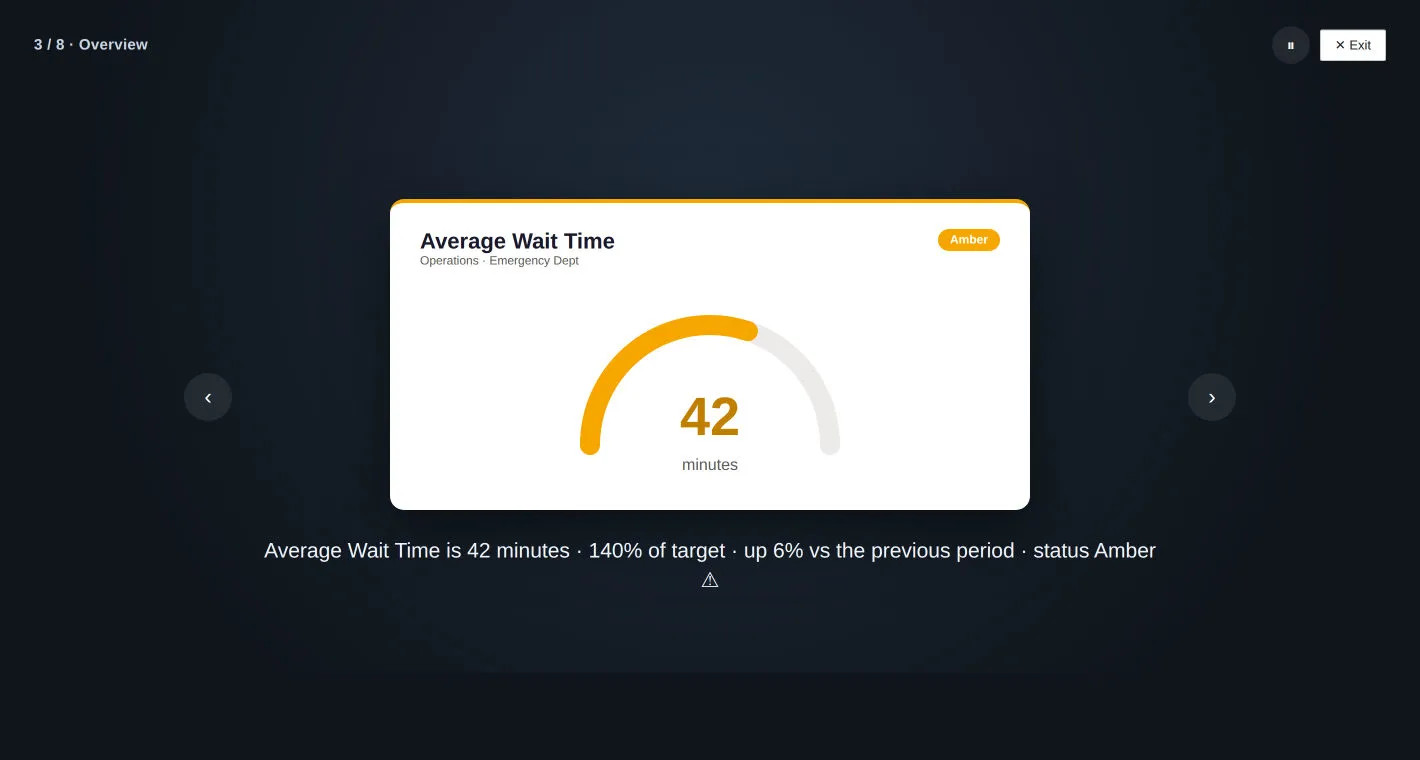
We built six SharePoint web parts offering thirteen calculation types and twenty-six visuals. Each KPI is defined as a list entry rather than in code, and can read from lists on any site or from Dataverse, Microsoft's business data platform.
The dashboards read every row, and any figure that reaches the safety limit is clearly marked as partial. Authors are warned while defining a KPI if a filter column needs an index, rather than viewers meeting a failure later. Caching cuts repeated requests.
An optional AI feature drafts a KPI definition from a plain-English sentence. It sends only list titles, column names and choice values, never list items, KPI values or user names.
Outcome
Built, covered by automated tests and independently reviewed, with the issues raised addressed.
Not yet deployed to a live tenant. Four completed features, including AI drafting and Arabic support, ship switched off, each with a documented reason.